Table of Contents

Data utilization, including the utilization of big data, is important. BI tools are attracting attention because they can visualize accumulated data and utilize it in corporate activities. Perhaps some of you reading this article want to introduce BI tools to improve your business. Therefore, this time, I will explain the functions and outline of the dashboard that you should know when using BI tools.
What is a BI tool dashboard?
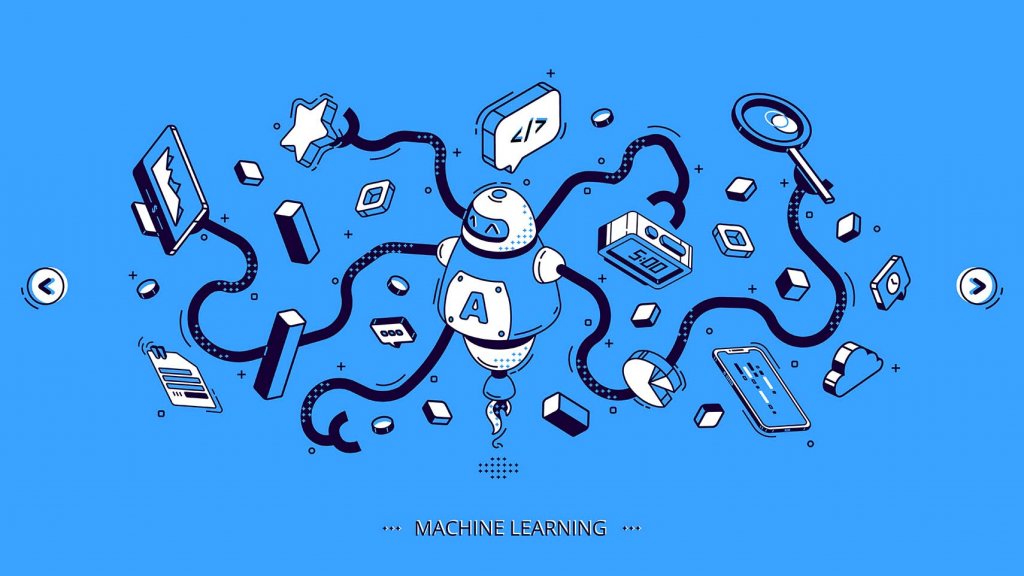
With BI tools, what’s called a dashboard comes up. What kind of thing is it? This section describes BI tools and dashboards.
What is BI tool?
BI is an abbreviation of “Business Intelligence”, which is for aggregating a large amount of data accumulated in a company and analyzing and visualizing the data. By visualizing, the results can be useful for management and business. Various tools such as “graphs, reports, charts” are provided as a means of visualization. Utilization of BI tools will help companies make appropriate decisions, which will lead to operational efficiency and business creation.
What is a dashboard?
A dashboard is a graph or summary table that analyzes and visualizes a large amount of data with BI tools and is displayed together on one screen. With BI tools, it is possible to create various graphs while using a wide variety of data. Companies can carry out management activities efficiently by carrying out management activities while looking at these various graphs.
Difference from the report
When using the dashboard, the word report may come up and you may be wondering what the difference is. A report is a list of records that meet pre-defined conditions. The big difference from the dashboard is whether the data is updated in real time. The dashboard is updated in real time to output graphs etc. while referring to the data of BI tool. On the other hand, the report is not updated in real time because it is output by utilizing the data at that time.
Main features of the dashboard

The dashboard has the following features:
- Alert display function
- Data filtering function
- Detailed display function
Alert display function
The BI tool dashboard allows administrators to be alerted when a number in a graph or report they create exceeds a set limit. BI tools are basically used for the purpose of analyzing and visualizing the collected information, but they can also be used for monitoring work by utilizing the alert display function. When an alert arrives, it is possible to detect anomalies in advance, so the impact on business is small.
Data filtering function
You can filter the data in the dashboard of the BI tool by the filter function. At the time of analysis, it is more likely that the data for a certain period or status will be displayed rather than the entire data. At that time, even if the dashboard is displayed once, you can easily specify the display format and range from the screen with the filter function.
Detailed display function
The detailed display function is a function that allows you to drill down to dig deeper into the items displayed in graphs and reports. Specifically, when you want to refer to the store information for each area, you can display the information in detail like Tokyo → Suginami Ward → Suginami Branch.
Benefits of using the dashboard

By utilizing the dashboard, you can get the following benefits.
- Information will be updated soon
- A variety of data can be aggregated
- Easy to clarify the situation
Information will be updated soon
As mentioned above, the dashboard of BI tools changes in real-time as the data is updated. Graphs and schedules are displayed together on one screen in the dashboard, but when the data is updated, the ones in the dashboard also change. Real-time updates enable you to make management decisions with the latest data, as well as improve efficiency in a variety of corporate activities such as marketing activities.
A variety of data can be aggregated
BI tools can aggregate a wide variety of data, so you can use it flexibly according to your purpose. For example, let’s say you want to compare seasonal sales by product. At that time, not only can sales for each product be aggregated, but it is also clarified what kind of price fluctuations are occurring depending on the season and season. Comparing related data will make it easier to utilize analytical work for corporate activities.
Easy to clarify the situation
By displaying business-related graphs on the dashboard, you can check the status at that time at a glance. Business is changing every day and must change in response to changes in society. At that time, keeping the data you need on your dashboard always visible helps you get a clear picture of your business and adapt to change.
Other features of BI tools

In addition to the dashboard, BI tools have the following functions.
- Data mining function
- OLAP analysis function
- Simulation function
Data mining function
The data mining function is used during data analysis and is a function that finds common movements and rules from a huge amount of data by making full use of techniques such as statistics and pattern recognition. Currently, many companies are promoting DX, and we are promoting the introduction of various systems. As the number of systems increases, so does the amount of data generated within the system. It is very difficult for humans to analyze such a large amount of data because it takes an enormous amount of time. Therefore, the data mining function that utilizes AI makes it possible to efficiently find out the rules of data.
OLAP analysis function
OLAP is an abbreviation of “Online Analytical Processing”, which is translated as online analytical processing in Japanese. The OLAP analysis function analyzes the huge amount of data accumulated in a company in multiple dimensions. Basically, system data is stored in various databases. In order to utilize these data, specialized work such as extracting necessary data by SQL statement or outputting to CSV and importing is required. However, for companies that lack IT human resources, the hurdles to utilize them will be high. Therefore, with BI tools, the OLAP analysis function enables data utilization with simple drag and drop.
Simulation function
The simulation function is a function that can utilize the past data accumulated in the company and perform future simulations to make decisions such as budget plans. The simulation function is used not only for budget planning but also for corporate marketing activities. If you don’t run a simulation, you tend to rely on your experience and intuition. However, even if you make a plan with unfounded data, you cannot accumulate know-how for the future. It can be said that the simulation function can be used when planning.
How to choose BI tools

When choosing a BI tool, keep the following in mind:
- Ease of introduction
- Full of functions
- ease of use
Ease of introduction
BI tools can be on-premises or cloud-based. The cloud type can be easily introduced because it can be used without the need to build an environment such as a server in-house. On the other hand, the on-premise type requires the preparation of hardware such as a server and the construction of a server, which requires financial and time costs. Choose cloud-based tools for easy deployment.
Full of functions
When choosing a BI tool, it is important to have a function that can solve your company’s problems. When making a selection, start by clarifying the purpose of deploying the tool. By clarifying the purpose, it becomes clear that this is the only part that cannot be surrendered, so it is decided while satisfying the essential functions and considering cost performance. Try to select a tool that suits your company so that you do not say “I introduced a high-performance CRM tool but never used it”.
ease of use
Not limited to BI tools, it is important that they are easy to use when introducing tools to companies. Deploying the tool is not only costly, but also requires human resources. If it becomes a tool that is not used even if it is introduced, everything will be wasted. Therefore, let’s be aware of whether the operability is simple and easy for the user to understand.
Streamline data analysis with the no-code AI cloud “UMWELT”!
BI tools should be actively introduced so that corporate data can be used efficiently. However, many people may not know which tool to choose. Therefore, we recommend TRYETING’s no-code AI cloud “UMWELT”. Since UMWELT is a cloud type, advanced AI can be utilized with no environment construction required and low initial cost. It comes with a number of algorithms that are useful for BI and can be used without programming. It is used by companies in a wide range of industries, from major companies to start-ups.
summary
The dashboard is a function to display graphs and reports created by BI tools on one screen. When deploying BI tools, dashboards help you perform analytical tasks efficiently. If you want to work on data analysis or introduce BI tools, please consider UMWELT of TRYING.
Follow us on Facebook for updates and exclusive content! Click here: Maga Techs